

The dashboard appears on the landing page when a user logs into the Q2 Platform. The dashboard displays a clear summary of a building’s network and the key performance indicators in real-time. All data sets are live, meaning information is showing current performance indicators.
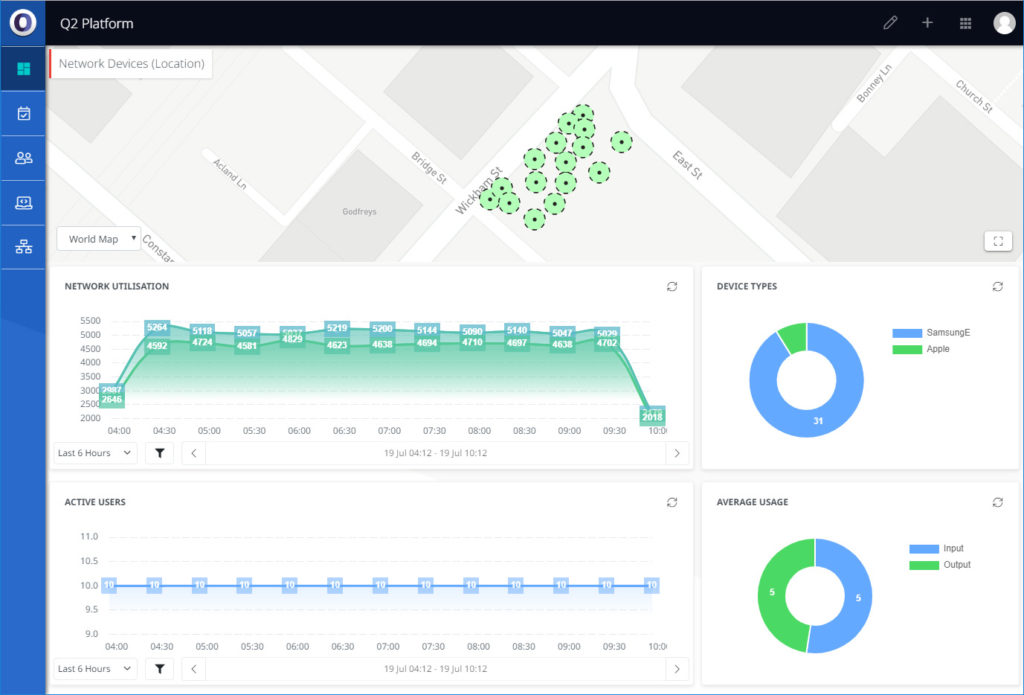
The dashboard is separated into a full-width map at the top and four half-width Widget panels underneath.
Map
The top section of the dashboard displays a map that provides location data on users and devices. This section can be expanded into a full-page view by clicking the bottom right button in the map section.
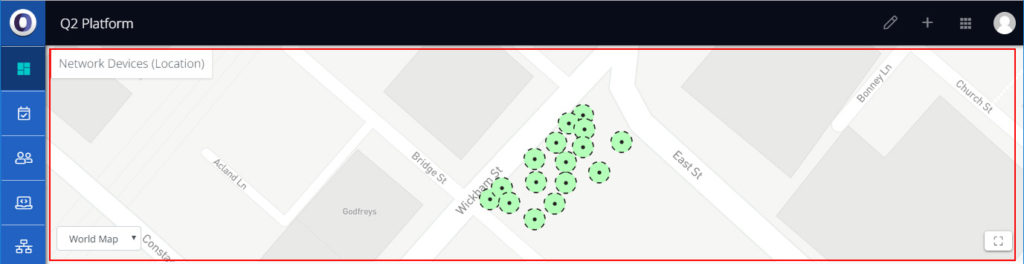
The dropdown menu in the bottom left corner of the map allows selection of alternate maps. This dropdown menu can be used to display different floors within a building (where relevant).
The title in the top left corner of the map section shows the type of information that is currently being displayed on the map. Clicking the title toggles a dropdown menu that allows for selection of alternative display information, which includes the following options:
- Active User Chart
- Active Devices
- Average users in Mbps (up/down)
- Network Devices (Location)
- Network Devices (Count)
Widgets
The four Widgets displayed are:
- Network Utilisation (amount of data being uploaded and downloaded)
- Number of Active Users
- Device Types
- Average Usage
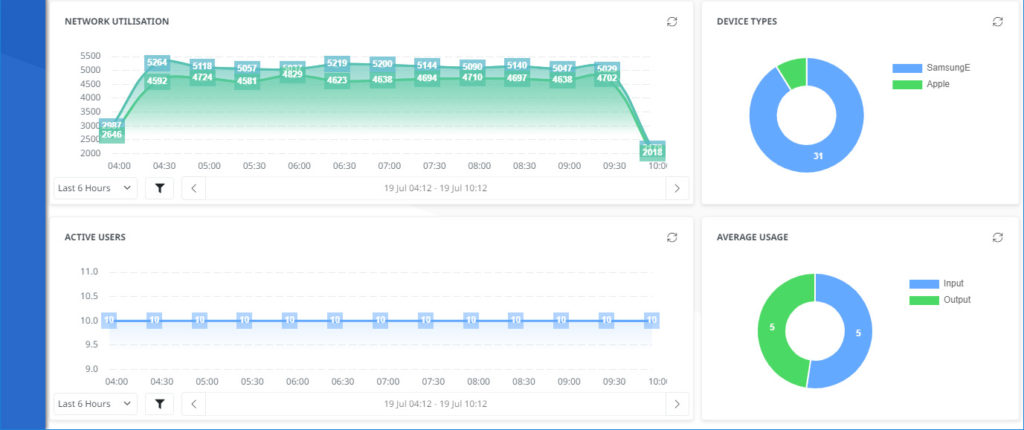
For each Widget, the time period displayed can be adjusted by using the dropdowns and filters found at the bottom of each panel.